October 15, 2023 – By Emily Becker – El Niño is currently purring along in the tropical Pacific. Forecasters expect El Niño will continue through the spring, with a 75-85% chance it will become a strong event. A stronger El Niño—definition to follow shortly—means it is more likely that we will see El Niño’s expected thumbprint on winter temperature and rain/snow patterns around the world.
The tiger’s stripes
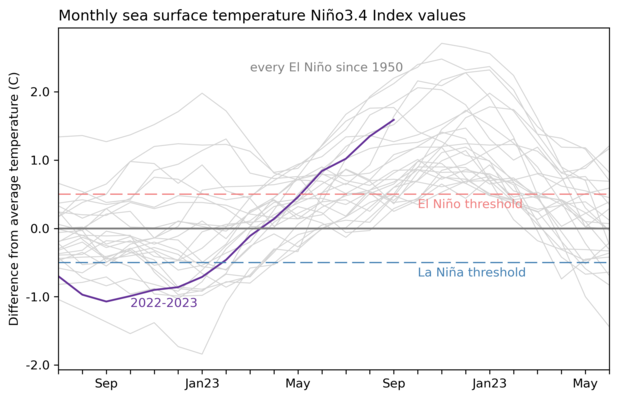
First, the numbers. Our primary metric for the growth of El Niño is the temperature of the ocean surface in the Niño-3.4 region, a box in the central-eastern equatorial Pacific. Specifically, the anomaly, the difference of this temperature from the long-term average (long-term = 1991–2020). (Why here? Several decades ago, this region was found to have the strongest relationship with tropical atmospheric changes.) In September, the Niño-3.4 Index was 1.6 °C (2.9 °F), according to the ERSSTv5, our most reliable sea surface temperature dataset.
2-year history of sea surface temperatures in the Niño-3.4 region of the tropical Pacific for all events evolving into El Niño since 1950 (gray lines) and the current event (purple line). NOAA Climate.gov image based on a graph by Emily Becker and monthly Niño-3.4 index data from CPC using ERSSTv5.
El Niño is a coupled system, meaning the ocean and the tropical atmosphere are working together to continue and grow the El Niño event. The average air circulation pattern over the tropical Pacific, called the Walker circulation, brings rising air, clouds, and storms over the very warm water of the far western Pacific, west-to-east winds high up in the atmosphere, descending air over the eastern Pacific, and the east-to-west surface winds called the trade winds. In the case of El Niño, the warmer-than-average surface water in the central-eastern Pacific leads to more rising air over that region, weakening the Walker circulation.
The atmospheric half of El Niño is clearly showing its stripes. All the signs of a weakened Walker circulation are present, including more rain and clouds over the central-eastern Pacific, slower trade winds and upper-level winds, and drier conditions in Indonesia and the far western Pacific. Taken collectively, the ocean surface and the atmospheric conditions tell us that El Niño will stick around for the next few months at least.
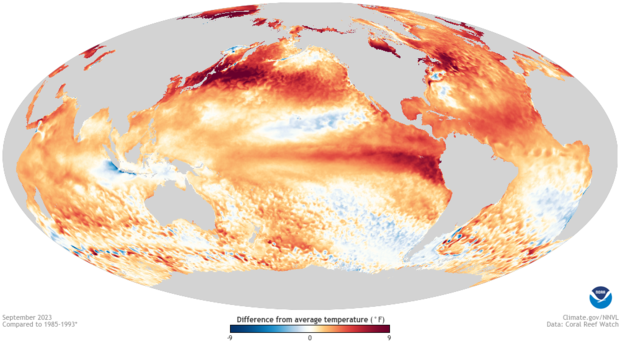
September 2023 sea surface temperature difference from the 1985-1993 average (details from Coral Reef Watch). Much of the global oceans are warmer than average. NOAA Climate.gov image from Data Snapshots.
The lion’s roar
Since we’re sure El Niño will be operating into the winter, the next question is “how strong will it get?” Strength definitions, which usually also use the Niño-3.4 Index, are unofficial, since it’s not like an El Niño with a peak Niño-3.4 Index of 1.5 °C is going to have noticeably different impacts than one with a peak Niño-3.4 Index of 1.4 °C. However, as I mentioned above, the stronger the El Niño, the more likely it will affect global temperature and rain/snow patterns in expected ways. This is because a larger sea surface temperature change leads to a larger shift in the Walker circulation, making it more likely that El Niño will affect the jet stream and cause a cascade of global impacts.
The unofficial definition of a strong El Niño is a peak 3-month-average Niño-3.4 Index of at least 1.5 °C. El Niño is a seasonal phenomenon, and that 3-month-average Niño-3.4 Index (called the Oceanic Niño Index or ONI) is important for making sure that the oceanic and atmospheric changes persist long enough to affect global weather and climate. A peak ONI of 2.0 °C or more is considered “historically strong,” or “very strong.” We’ve only seen four of these in our historical record, dating back to 1950.
Forecasters give this event a high chance of qualifying as a strong event, based on our climate model predictions and the current conditions. “Hey wait,” you’re saying. “Isn’t the September Niño-3.4 Index already 1.6 °C?” And indeed it is, but the 3-month-average for July–September was 1.3 °C. That said, we have a 75% chance that the ONI will reach or exceed 1.5 °C in November–January (typically the peak season). We actually have a slightly higher chance, 83%, that we will reach that threshold in September-November, which is on our doorstep.
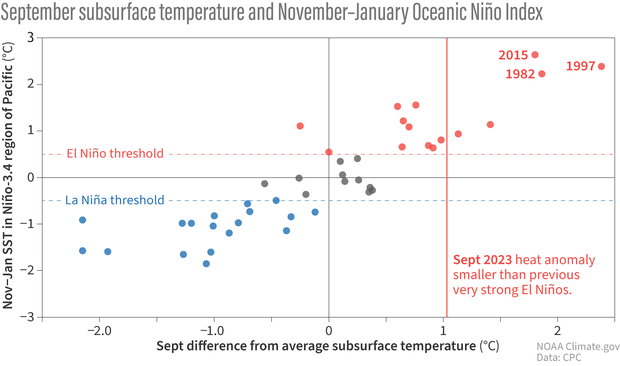
So how about peaking at or above 2.0 °C? Forecasters give that around a 3-in-10 chance for November–January. The climate models have a fairly wide range of potential outcomes—if they were concentrated above 2.0 °C, we’d probably be able to give more confident chances. Also, while there is still a good amount of heat under the surface of the Pacific—this warmer water provides a source to the surface—it’s not quite at the level we’ve seen during previous historically strong El Niños like 1982–83, 1997–98, or 2015–16.
Each dot on this scatterplot shows the subsurface temperature anomaly (difference from the long-term average) in the central tropical Pacific each September (horizontal axis) since 1979 versus the oceanic ENSO conditions the following November–January (vertical axis). The vertical red line show the September 2023 subsurface temperature anomaly. The amount of warmer-than-average water under the surface in September has a strong relationship with the oceanic ENSO conditions later in the year. Previous very strong El Niño events, 1982–83,1997–98, and 2015–16, had more subsurface warm water than 2023. Data from CPC, image by Climate.gov.
This is a small sample of very strong events, though, and the current moderate subsurface temperature certainly doesn’t preclude this event peaking above 2.0 °C. It just contributes to a tempering of the odds.
The leopard’s spots
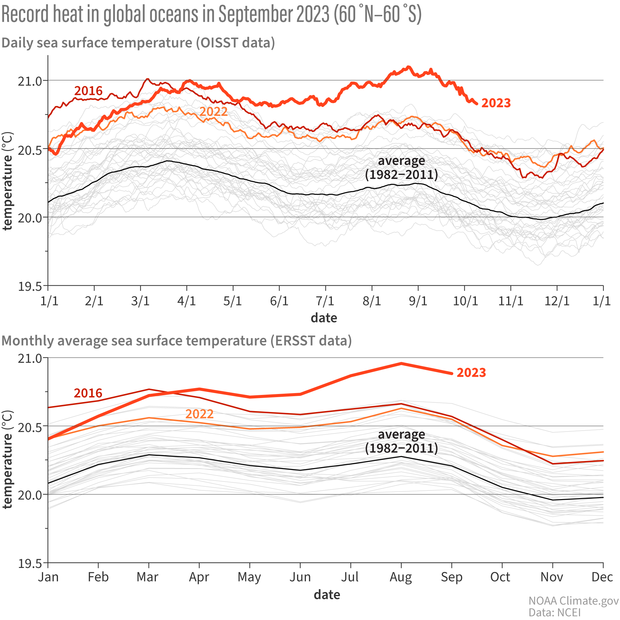
One more thing I wanted to cover this month—the temperature of the global oceans is still running way above average, with startling records in recent months.
Non-polar (60 °N – 60 °S) global averaged sea surface temperature from 1982-2023 from (top) daily OISSTv2.1 and (bottom) monthly ERSSTv5 datasets. The thick black lines represent the 1982-2011 average across the calendar year; 2022 (orange line), 2023 (thick red line), and 2016 (the year of record warmth before 2023; thin red line) are highlighted. The thin grey lines represent all other years. Both graphs indicate that the last few months have experienced record global ocean warmth. NOAA Climate.gov image based on graphs by Boyin Huang and data from NCEI.
We last featured these graphs, kindly provided by Dr. Boyin Huang of the National Centers for Environmental Information, in May. They show two different datasets, one with daily values and one with monthly averages. Whenever we see something really extraordinary, like the recent records, we want to be sure it’s not a data error. Checking two different datasets provides confirmation that this is a real feature.
The extreme warmth in the global oceans—also noticeable in the map I showed above—means this El Niño is operating in a different world than earlier El Niño events. For example, the Atlantic hurricane season is often on the quieter side overall during El Niño, but this year has already seen an active season, with 18 named storms, as the very warm North Atlantic Ocean has provided lots of fuel.
Cat nap
We’re never going to sleep on the ENSO job! Check back later this month for a post on El Niño and snowfall patterns, and I’ll be back in November to update you on all things El Niño.
ENSO Blog
A blog about monitoring and forecasting El Niño, La Niña, and their impacts.
Disclaimer:
The ENSO blog is written, edited, and moderated by Michelle L’Heureux (NOAA Climate Prediction Center), Emily Becker (University of Miami/CIMAS), Nat Johnson (NOAA Geophysical Fluid Dynamics Laboratory), and Tom DiLiberto and Rebecca Lindsey (contractors to NOAA Climate Program Office), with periodic guest contributors.
Ideas and explanations found in these posts should be attributed to the ENSO blog team, and not to NOAA (the agency) itself. These are blog posts, not official agency communications; if you quote from these posts or from the comments section, you should attribute the quoted material to the blogger or commenter, not to NOAA, CPC, or Climate.gov.
Source: ENSO blog team


 program to allow qualified entities to support the Department in its defensible space and home hardening assessment and education efforts. Qualified entities are local, or state government agencies, academic staff, or other approved organizations who have undergone the new OSFM Defensible Space Assessment Program training detailed below.